Convenience wrapper to plot spatial outputs from a
solutionset-class object returned by solve.
Depending on what, this function dispatches to one of:
This wrapper is useful as a compact entry point, while the specialised plotting functions provide a cleaner and more explicit user interface for each spatial output type.
Usage
plot_spatial(
  x,
  what = c("pu", "actions", "features"),
  runs = NULL,
  actions = NULL,
  features = NULL,
  value = c("final", "baseline", "benefit"),
  layout = NULL,
  max_facets = 4L,
  ...,
  base_alpha = 0.1,
  selected_alpha = 0.9,
  base_fill = "grey92",
  base_color = NA,
  selected_color = NA,
  draw_borders = FALSE,
  show_base = TRUE,
  fill_values = NULL,
  fill_na = "grey80",
  use_viridis = TRUE
)
Arguments
- x
A
solutionset-classobject returned bysolve.- what
Character string indicating what to plot. Must be one of
"pu","actions", or"features".- runs
Optional integer vector of run ids. If
NULL, the first available run is plotted by default.- actions
Optional action subset used when
what = "actions".- features
Optional feature subset used when
what = "features".- value
Character string used only when
what = "features". Must be one of"final","baseline", or"benefit".- layout
Character string controlling the layout. Must be one of
"single"or"facet". IfNULL, the default is"single"for planning units and actions, and"facet"for features.- max_facets
Maximum number of facets shown when faceting without an explicit action or feature subset.
- ...
Additional arguments passed to the specialised plotting function.
- base_alpha
Numeric value in \([0,1]\) giving the alpha of the base planning-unit layer.
- selected_alpha
Numeric value in \([0,1]\) giving the alpha of the highlighted layer.
- base_fill
Fill colour for the base planning-unit layer.
- base_color
Border colour for the base planning-unit layer.
- selected_color
Border colour for highlighted layers.
- draw_borders
Logical. If
FALSE, borders are not drawn.- show_base
Logical. If
TRUE, draw the base planning-unit layer underneath the highlighted output.- fill_values
Optional named vector of colours for discrete maps.
- fill_na
Fill colour for missing values.
- use_viridis
Logical. If
TRUEand the viridis package is available, use viridis scales.
Examples
if (
requireNamespace("sf", quietly = TRUE) &&
requireNamespace("ggplot2", quietly = TRUE) &&
requireNamespace("rcbc", quietly = TRUE)
) {
data("sim_pu_sf", package = "multiscape")
pu <- sim_pu_sf[
seq_len(min(4L, nrow(sim_pu_sf))),
]
pu$id <- seq_len(nrow(pu))
pu$cost <- seq_len(nrow(pu))
features <- data.frame(
id = 1L,
name = "feature_1"
)
dist_features <- data.frame(
pu = pu$id,
feature = 1L,
amount = rep(1, nrow(pu))
)
problem <- create_problem(
pu = pu,
features = features,
dist_features = dist_features,
cost = "cost"
) |>
add_constraint_targets_relative(0.25) |>
add_objective_min_cost(alias = "cost") |>
set_solver_cbc(verbose = FALSE)
solutions <- solve(problem)
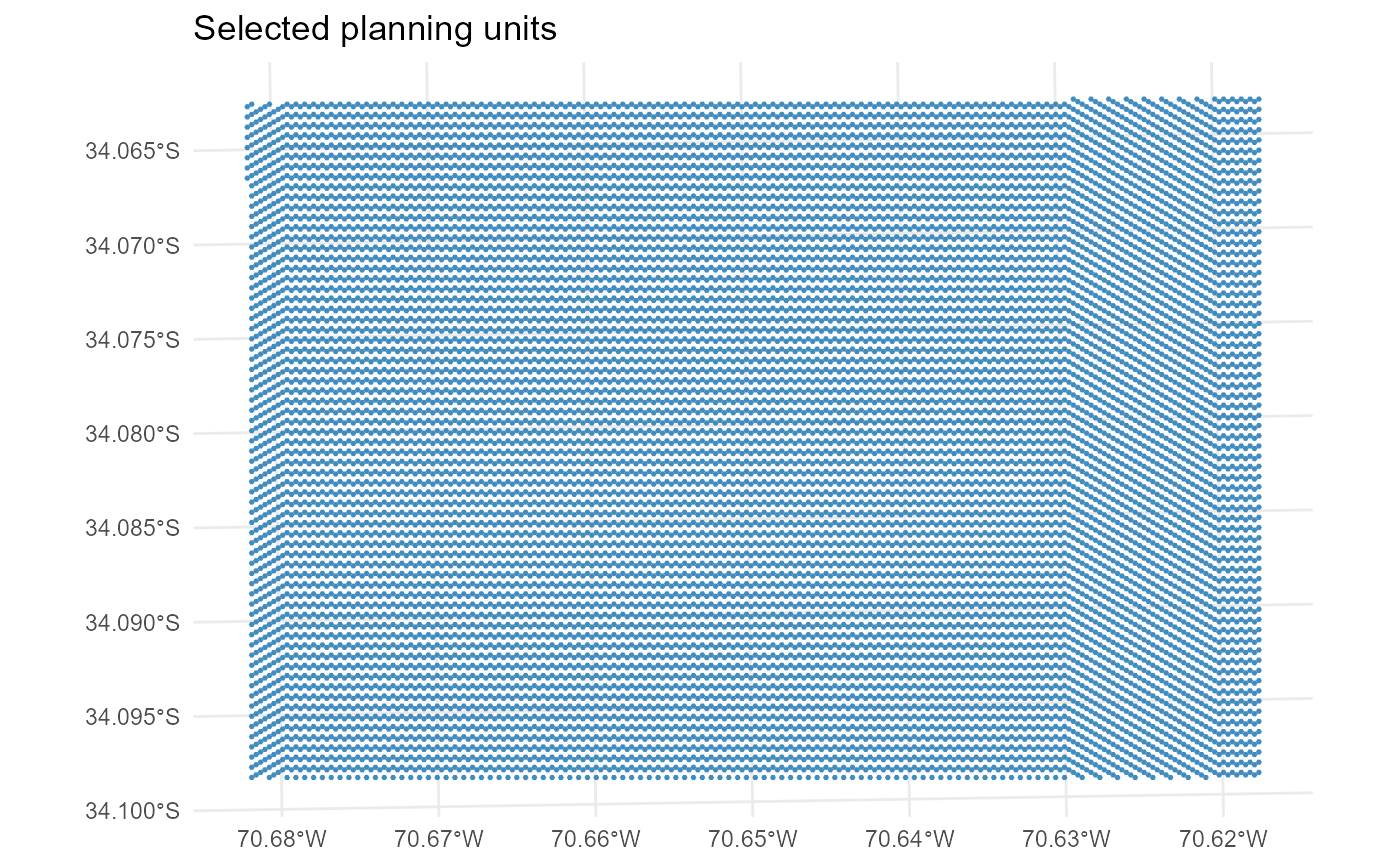
plot_spatial(
solutions,
what = "pu"
)
}